Getting Started
How It Works
Some technical details about how the debugbar works
The debugbar is organized in 2 main parts:
- The backend: a Rack middleware that collects data about the current request and stores it in a buffer
- The frontend: a Vue 3 app that renders the data
The full cycle
Generally speaking, the debugbar works like this. Remember that you need to include the debugbar view in your layout.
- In your browser, you load the first page of your app.
- The request goes through all the Rack middleware, including the debugbar middleware.
- This triggers the gem to start tracking the request.
- On its way out, the response also goes back through all the Rack middleware.
- At this point, we store what we collected. Nothing is sent in this response.
- The frontend is displayed in the browser.
- The debugbar is loaded (since you included it in your layout).
- On load, the debugbar connects to your backend via a websocket, using ActionCable.
- The backend pushes the data to the frontend, and the Vue app renders it.
Now, if you make another full page reload, the cycle starts again.
If you make a XHR request, like in an SPA or Hotwire app, it will be a little different.
- At this point, the debugbar is already loaded in the browser and connected to the backend.
- A new request is made to the backend, via XHR.
- It goes through the Rack middleware again, the same data is collected.
- But when the response is sent back, the backend pushes this new data to the frontend directly.
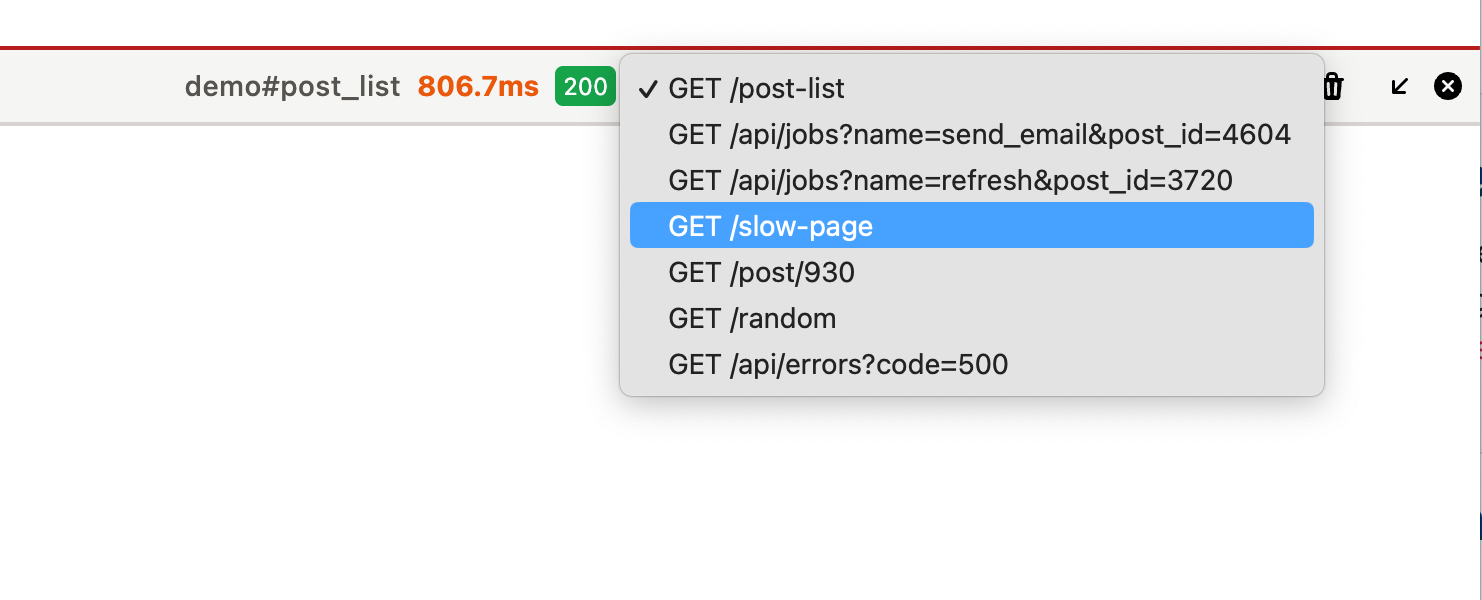
- The new request is visible in the select box of the debugbar.